How Do I Build a Debt Payoff Calculator in Excel to Track My Progress?
Build a simple Excel debt payoff calculator with five columns and one formula to see exactly when each debt hits zero.
Short answer
List each debt in its own row with columns for current balance, interest rate, minimum payment, and any extra payment you can add. Each month, reduce the balance by your payment minus that month's interest charge, which is the balance multiplied by the annual rate divided by 12. Copy those rows down 60 or 84 months and Excel will show you the exact month each debt reaches zero. Add a running total column and you have a live tracker you can update every payday.
Why a Spreadsheet Beats Any Debt App
Debt apps are convenient until you stop trusting them. They produce a payoff date, but you have no idea how they got there. A spreadsheet does something apps cannot: every number traces back to a formula you wrote yourself. When the balance drops faster than expected because you threw an extra $200 at it, you see exactly why. That transparency is what makes you believe the finish line is real.
I'd also argue that building it yourself, even once, teaches you more about how interest actually works than a year of making minimum payments. The numbers stop being abstract. They become something you made and can change.
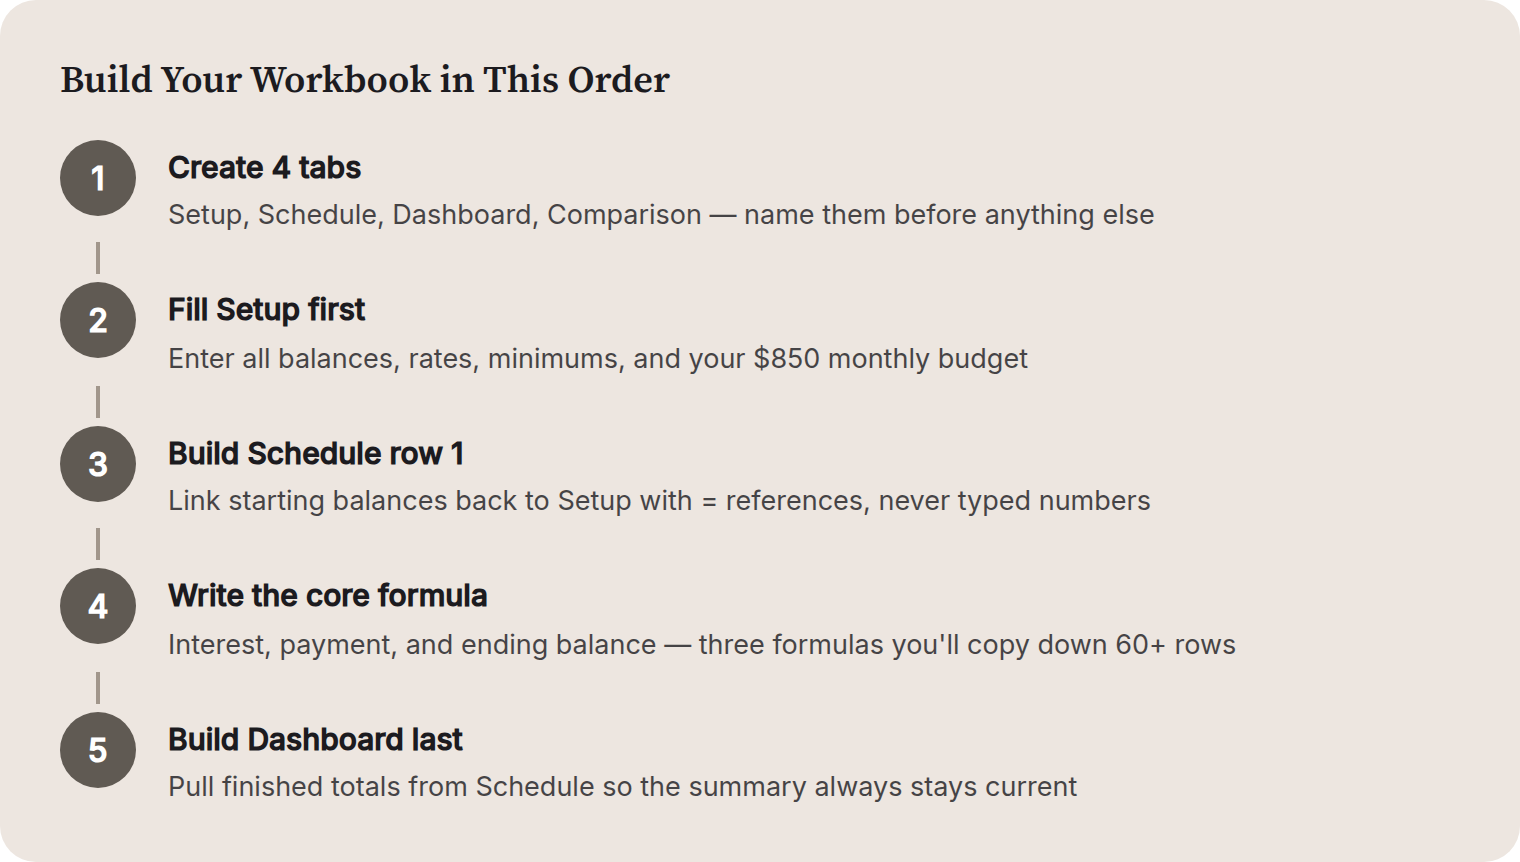
The Five Columns Every Tracker Needs
Start with a summary table at the top of a fresh sheet. One row per debt. Here are the five columns you need:
- Debt name (Visa, Car Loan, whatever you call it)
- Current balance in dollars
- Annual interest rate as a decimal — 22% goes in as 0.22
- Minimum monthly payment
- Extra payment — the amount above the minimum you can add each month
That last column is the one most people skip, and it is the most powerful one on the sheet. Even $50 extra per month compresses a payoff timeline dramatically once you can see the math.
Building the Monthly Reduction Formula
Let's use a real example. Say you have a credit card with a $4,200 balance, a 22% APR, a $95 minimum payment, and you are going to add $75 extra each month. Total monthly payment: $170.
Below your summary table, create a monthly amortization block. Label column A as Month, column B as Starting Balance, column C as Interest Charge, column D as Payment, column E as Ending Balance.
In Month 1, your starting balance is $4,200. The interest charge for that month is the balance times the monthly rate: =B2*(0.22/12). At 22% annual, that works out to about $77. Your payment is $170. Your ending balance is =B2+C2-D2, which gives you roughly $4,107. Enter that ending balance as the starting balance for Month 2, and copy the formulas down.
The formula that does the work
Ending Balance = Starting Balance + (Starting Balance × Annual Rate ÷ 12) − Payment. That is it. Copy it down 60 rows and the balance curve appears in front of you.
With $170 a month on that $4,200 balance at 22%, you are paid off in about 29 months and you will pay roughly $680 in interest. If you drop the extra payment to zero and pay only $95, that same debt takes over five years and costs you close to $1,500 in interest. That difference is exactly what you want to see before you decide what to cut from your budget.
Avalanche vs. Snowball — Using the Same Sheet for Both
The avalanche method puts all extra money toward the highest interest rate first. The snowball method attacks the smallest balance first. Neither is wrong. The avalanche saves more money on paper. The snowball gives you a faster psychological win.
Here is how to test both in the same workbook. Build two tabs — one labeled Avalanche, one labeled Snowball. On the Avalanche tab, sort your debts by interest rate, highest first, and assign your full extra payment to that top row. On the Snowball tab, sort by balance, smallest first, and do the same thing. When one debt reaches zero in either scenario, move that payment to the next debt on the list. Run both out 60 months and compare total interest paid and payoff dates. The difference between strategies for most people with two or three debts is smaller than expected — often a few hundred dollars and a couple of months.
Mistakes That Wreck the Math
- Using the annual rate without dividing by 12. Your credit card charges you monthly, not yearly. Forgetting that step makes your interest look 12 times too high.
- Not locking reference cells with dollar signs. If your annual rate lives in cell B3 and you drag a formula down, it will drift to B4, B5, and so on. Use $B$3 to pin it.
- Ignoring minimum payments on other debts while attacking one. Every debt needs at least its minimum covered every month, or you trigger fees and damage your credit.
- Treating the minimum payment as fixed when it is not. Some cards recalculate minimums as balances drop. For simplicity, hold the payment constant — it means you are actually paying slightly more than the minimum later, which helps you.
Adding a Chart So You Can See Progress
Select your Month column and your Ending Balance column, then insert a line chart. That curve dropping toward zero is worth more than any motivational article. Print it and put it somewhere visible. When you make an extra payment and update the balance, the curve drops faster. That feedback is immediate and concrete.
If you have multiple debts, add a column that sums all ending balances for that month and chart the combined total. Watching the aggregate number fall is what most people mean when they say they finally feel like they are making progress.
What to Do After You Build It
Pick one date per month — payday is a good anchor — and spend ten minutes updating the actual balances. Do not wait for the month to feel right or for a big payment to come in. Regular updates matter more than perfect updates.
And when the first debt hits zero, do not quietly redirect that payment and move on. Note the month. Write it down somewhere. That payment amount now gets added to the next debt on your list, and the momentum compounds. The sheet will show you that — which is the whole point.
The spreadsheet does not judge the size of the balances. It just shows you the month they end. That is enough.
Questions people also ask
What if my minimum payment changes every month?
Hold it constant at the current amount. Most credit card minimums shrink as the balance drops, so keeping your payment fixed means you are paying more than required as time goes on. That only helps you pay off faster.
How do I handle a debt with a 0% promotional rate that expires?
Create two phases in the amortization block. Run the first section with a rate of 0% until the promo end month, then switch the rate to the go-to rate for the remaining rows. This shows you exactly what happens if you do not clear the balance before the offer expires.
Should I include my mortgage in this tracker?
You can, but I would keep it on a separate tab. Mortgages span 15 to 30 years and behave differently from revolving credit. Mixing them with credit cards makes the chart harder to read and the progress feel slower than it actually is.
What if I can only afford minimum payments right now?
Build the sheet with zero in the extra payment column. Seeing the payoff date, even if it is uncomfortable, is better than not knowing. It also gives you a clear target — if you can find even $30 extra, you will see the date move, which is motivating.
Does this work in Google Sheets instead of Excel?
Yes, the formulas are identical. Google Sheets uses the same syntax for multiplication, division, and cell references. The only difference is how you insert a chart, and that is a right-click away in either program.
The Full Guide
The Debt Payoff Calculator You'll Actually Use

- A ready-to-use Excel template with all five columns and formulas already built in — just enter your numbers
- Side-by-side avalanche and snowball scenarios with a worked example across four real debts
- A monthly update checklist so the tracker stays accurate and your payoff dates stay honest